Weekly market wrap


Two tariff scenarios and the impacts on key macroeconomic and market variables
Key Takeaways:
- This past week, stock markets were modestly lower, with the S&P 500 down 1.5%, and the tech-heavy Nasdaq down around 2.6%. For the full year, the S&P 500 is now down about 10.2%, while the Nasdaq is lower by around 15.7%.
- The move last week was driven once again by tariff uncertainty. New export restrictions on semiconductors to China put pressure on large U.S. semi companies like NVIDIA. In addition, Fed Chair Powell reiterated that the Fed is likely to remain patient on rate cuts, given that tariffs potentially weigh on both inflation and economic growth.
- Perhaps the good news was that the bond market last week functioned in a more orderly manner. As stocks fell, government bond yields moved lower, with the 10-year Treasury yield lower by about 0.16% this week alone, moving prices higher. The U.S. Agg bond index climbed about 1% for the week, providing some diversification benefit for balanced investors.
- Nonetheless, the broader markets continue to be driven by the tariff narrative in the near term. Below we outline two different tariff scenarios – one with a moderate escalation in tariffs and one with high tariff rates in place – and examine the impacts on key economic and market variables. Overall, even a moderately higher tariff regime will negatively impact both inflation and economic growth but perhaps can be offset by fiscal and monetary policy as we head toward 2026.
Scenario 1: Moderate Tariffs
The moderate-tariff scenario is currently the highest probability outcome, in our view. In this scenario, tariffs on most trading partners stay around 10%, with ongoing negotiations moving some rates and nontariff barriers lower. The tariffs on China and critical sectors like autos, steel and aluminum likely remain elevated; however, the negotiation between the U.S. and China is more productive and current tariff rates could move lower. Overall, average tariff rates in this scenario are still around 10% to 15% in the U.S.
Economic growth and inflation: In this scenario, we would expect core CPI inflation to rise to 3.5% to 4%, up from current levels of about 2.4%. We would expect inflation to gradually rise over the course of the next few months, as companies work down existing inventories and replenish these at higher post-tariff prices. However, while inflation may rise, we would expect it to peak this year and perhaps even move lower by next year, as yearly comparisons ease versus this year's rise in prices. This is similar to the inflation trend that the Fed outlined in its March 2025 meeting.
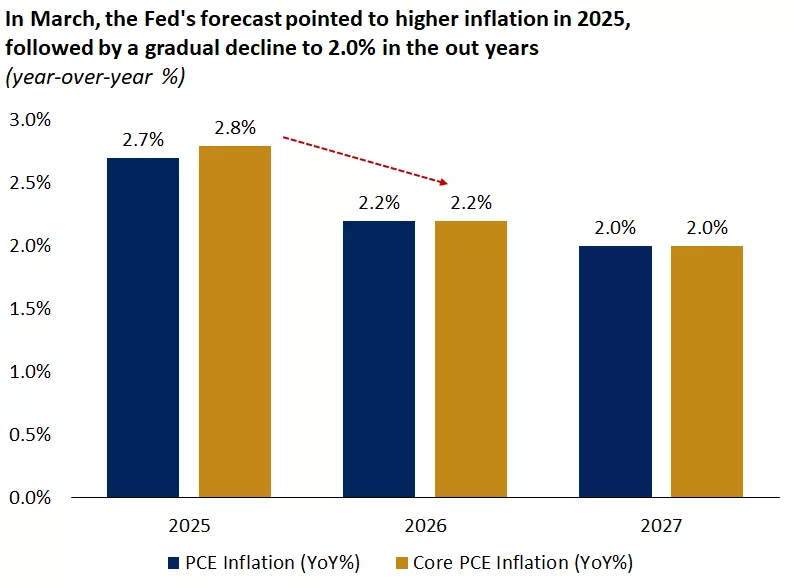
This chart shows FOMC inflation projections from the March 2025 meeting.
This chart shows FOMC inflation projections from the March 2025 meeting.
For economic growth, under a moderate tariff regime, we would expect the economy to slow, but growth would likely remain positive this year, as households continue to spend on goods and services, albeit at a softer pace. According to the 2018 Fed model, an increase in tariffs by 10% would imply a softening in growth of about 1.4 percentage points, indicating growth may moderate to around 1% annualized this year. While we may see a quarter of negative growth this year, we would not expect a recession in the U.S. in the year ahead.
Federal Reserve: The Federal Reserve continues to be caught between "a rock and a hard place" as it navigates potentially higher inflation and lower economic growth. The Fed has already told us that it plans to remain patient as the data unfolds. In our view, inflation is likely to rise first, followed by a more pronounced slowdown in consumer and corporate spending, and then potentially higher unemployment and softer labor markets – typically a lagging indicator.
The Fed may act when it starts to see elevated tariffs impact the hard data, like consumer spending and ultimately lower GDP growth and higher unemployment. Given these will likely emerge more so in the back half of the year, the Fed may be on hold until the second half of 2025. We would expect the Fed to cut rates perhaps two or three times this year in this scenario, in line with the two rate cuts it outlined in the March meeting.
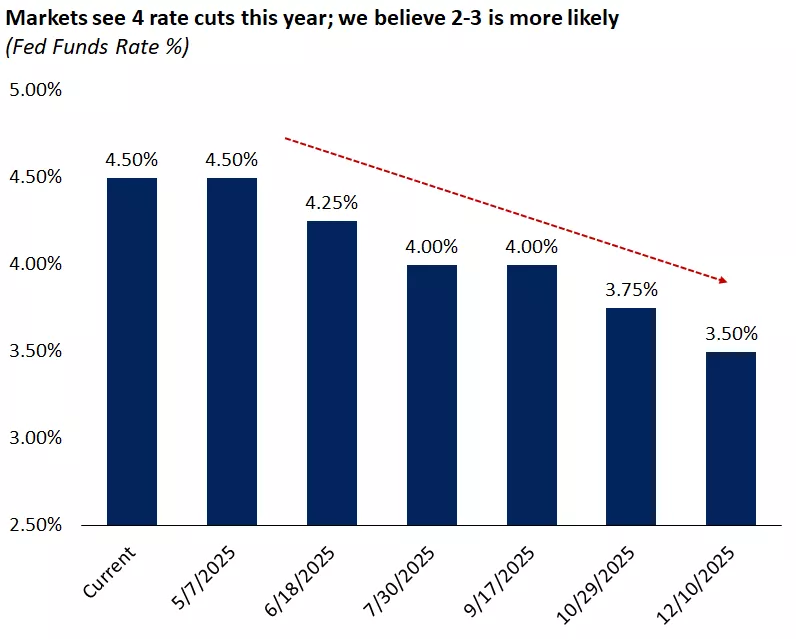
This chart shows that markets are pricing in 4 Fed rate cuts as of April 17, 2025.
This chart shows that markets are pricing in 4 Fed rate cuts as of April 17, 2025.
Stock and bond markets: So how would markets react under this scenario? While we would not expect a V-shaped recovery from here in markets, we could see stabilization in the months ahead. S&P 500 returns are typically driven by earnings and valuation expansion. In a moderate-tariff scenario, we would expect S&P 500 earnings growth to be revised lower but still remain positive in the low- to mid-single-digit range. If valuations are steady or even contract a bit, this would imply flat returns for the S&P 500, which still is about 10% higher from today's mid-April levels.
We would continue to expect to see diversified portfolios holding up relatively well, with the S&P 500 equal-weight index perhaps outperforming the market-weight index (which remains heavily skewed to growth and tech sectors).
In bonds, we would expect bond yields to remain range-bound, with 10-year Treasury yields in the 4.0% to 4.5% range. We could perhaps see yields approach the lower end of the range as the Fed moves rates lower toward the back half of the year. Nonetheless, with yields still in the 4% range, we continue to see bonds playing an important role in diversified portfolios.
Scenario 2: Higher tariff rates
There is still a chance that tariff rates remain meaningfully higher in the year ahead, although this is a lower probability outcome in our view. In this scenario, the rates for China would likely remain near peak levels, key sector tariffs remain elevated, and perhaps rates on some trading partners move beyond 10% after the 90-day pause expires. In this case, the average tariff rate in the U.S. moves closer to 25%.
Under this scenario, we would expect a more negative impact across most economic and market variables. Inflation would likely trend toward 5%, while economic growth would likely fall into recession. The Federal Reserve would also be more likely to cut rates sooner and more often, with four or five rate cuts likely.
From a market perspective, given a potential recession in this scenario, we would expect the S&P 500 to likely move back toward a bear market, down 20% or more from recent highs. In addition, bond yields would likely move lower, given a flight-to-safety response in the markets. We would expect 10-year yields to fall below 4.0% in this scenario. Overall, we would expect to see investors gravitate toward defensive positioning in both stock and bond markets.
Since 1970, S&P 500 returns during a bear market have declined by an average of 39%, typically followed by a period of recovery:
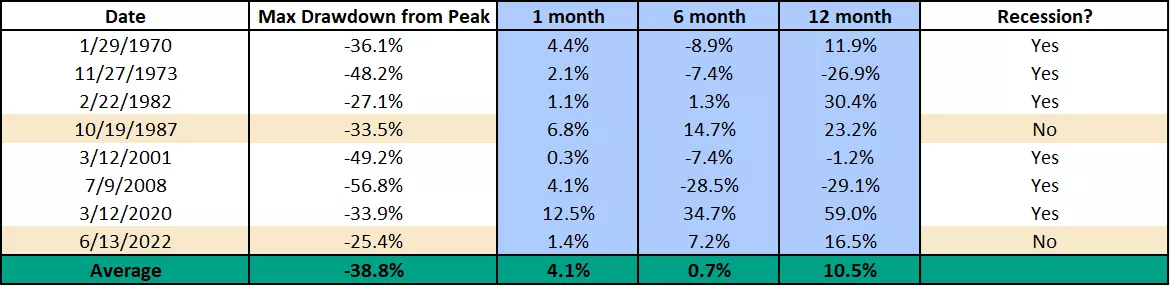
This chart shows the performance of the S&P 500 price index in the one-, six- and twelve-months following the date the S&P 500 first declined by 20% or more from an all-time high since 1970. Returns have on average, been positive in the months following a 20% decline from an all-time high. Past performance does not guarantee future results. An index is unmanaged, cannot be invested into directly and is not meant to depict an actual investment.
This chart shows the performance of the S&P 500 price index in the one-, six- and twelve-months following the date the S&P 500 first declined by 20% or more from an all-time high since 1970. Returns have on average, been positive in the months following a 20% decline from an all-time high. Past performance does not guarantee future results. An index is unmanaged, cannot be invested into directly and is not meant to depict an actual investment.
Portfolio positioning in times of uncertainty
Offsetting factors to tariffs
While uncertainty remains high in the year ahead with elevated tariffs weighing on inflation and growth, keep in mind that there may be some offsetting factors as we head through the year. First, the administration has pointed to tax reform and deregulation as a key part of its agenda. We would expect to see and hear more concrete plans for tax reform, and potentially lower taxes, in the weeks ahead, which would provide fiscal support and improve market sentiment.
Second, we would expect the Federal Reserve to move rates lower over time, providing monetary stimulus to the economy. Lower interest rates would support better borrowing costs for consumers and corporations and help boost spending broadly. Remember that over time corporations can adapt to different operating environments, and sometimes innovation and productivity gains follow.
Overall, while this year may be fraught with tariff and trade volatility, we could potentially be setting up for a better 2026, with incremental fiscal and monetary stimulus supporting economic growth.
Portfolio positioning – patience and diversification
While market volatility is never comfortable, it is a normal part of investing. Keep in mind that in any given year, two or three pullbacks are the norm, especially in years with heightened uncertainty. For long-term investors, time in the market has consistently been proven to be a better strategy than trying to time yourself in and out of the market, which can lead to poor investment decisions and lower returns.
Instead, focus on what you can control. Work with a financial advisor to ensure you have appropriate emergency cash on hand. And from a portfolio perspective, consider opportunities to rebalance, diversify, or gradually add quality investments at better prices across asset classes and sectors. Remember that tariff uncertainty over time may shift, and we could see better economic and earnings growth in the year ahead. And over a 10 or 20-year horizon, annualized portfolio gains have a much higher probability of being positive than not.
For long-term investors, holding stocks and bonds for a longer horizon increases the odds of positive annualized returns:
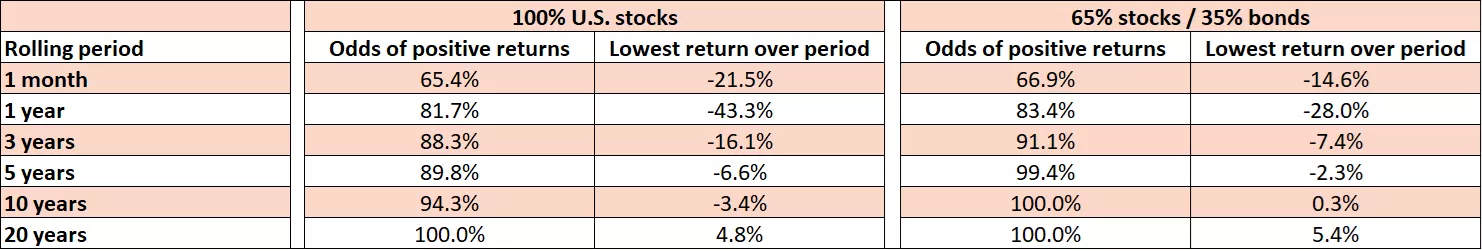
In the left column, this chart shows the percentage of time that the S&P 500 saw positive returns over a 1-month, 1-, 3-, 5-, 10- and 20-year time period along with the lowest return over each period. On the right column, this chart shows the percentage of time that a 65% stock 35% bond portfolio saw positive returns over a 1-month, 1-, 3-, 5-, 10- and 20-year time period along with the lowest return over each period. Returns assume the 65% stocks 35% bonds portfolio is rebalanced annually at the beginning of each year. For illustrative purposes only. Past performance does not guarantee future results. An index is unmanaged, cannot be invested into directly and is not meant to depict an actual investment.
In the left column, this chart shows the percentage of time that the S&P 500 saw positive returns over a 1-month, 1-, 3-, 5-, 10- and 20-year time period along with the lowest return over each period. On the right column, this chart shows the percentage of time that a 65% stock 35% bond portfolio saw positive returns over a 1-month, 1-, 3-, 5-, 10- and 20-year time period along with the lowest return over each period. Returns assume the 65% stocks 35% bonds portfolio is rebalanced annually at the beginning of each year. For illustrative purposes only. Past performance does not guarantee future results. An index is unmanaged, cannot be invested into directly and is not meant to depict an actual investment.
Mona Mahajan
Investment Strategist
Weekly market stats
| INDEX | CLOSE | WEEK | YTD |
|---|---|---|---|
| Dow Jones Industrial Average | 39,142 | -2.7% | -8.0% |
| S&P 500 Index | 5,283 | -1.5% | -10.2% |
| NASDAQ | 16,286 | -2.6% | -15.7% |
| MSCI EAFE* | 2,390.90 | 4.1% | 5.9% |
| 10-yr Treasury Yield | 4.33% | -0.1% | 0.4% |
| Oil ($/bbl) | $63.65 | 3.5% | -11.3% |
| Bonds | $97.87 | 0.9% | 2.2% |
Source: FactSet, 4/17/2025. Bonds represented by the iShares Core U.S. Aggregate Bond ETF. Past performance does not guarantee future results. *Morningstar Direct 4/20/2025.
The week ahead
Important economic releases this week include PMI data and new home sales for March.
Review last week's weekly market update.
Mona Mahajan
Mona Mahajan is responsible for developing and communicating the firm's macroeconomic and financial market views. Her background includes equity and fixed income analysis, global investment strategy and portfolio management.
She regularly appears on CNBC and Bloomberg TV, and in The Wall Street Journal and Barron’s.
Mona has a master’s in business administration from Harvard Business School and bachelor's degrees in finance and computer science from the Wharton School and the School of Engineering at the University of Pennsylvania.
Important Information:
The Weekly Market Update is published every Friday, after market close.
This is for informational purposes only and should not be interpreted as specific investment advice. Investors should make investment decisions based on their unique investment objectives and financial situation. While the information is believed to be accurate, it is not guaranteed and is subject to change without notice.
Investors should understand the risks involved in owning investments, including interest rate risk, credit risk and market risk. The value of investments fluctuates and investors can lose some or all of their principal.
Past performance does not guarantee future results.
Market indexes are unmanaged and cannot be invested into directly and are not meant to depict an actual investment.
Diversification does not guarantee a profit or protect against loss in declining markets.
Systematic investing does not guarantee a profit or protect against loss. Investors should consider their willingness to keep investing when share prices are declining.
Dividends may be increased, decreased or eliminated at any time without notice.
Special risks are inherent in international investing, including those related to currency fluctuations and foreign political and economic events.
Before investing in bonds, you should understand the risks involved, including credit risk and market risk. Bond investments are also subject to interest rate risk such that when interest rates rise, the prices of bonds can decrease, and the investor can lose principal value if the investment is sold prior to maturity.